Aqualinc: How land is irrigated
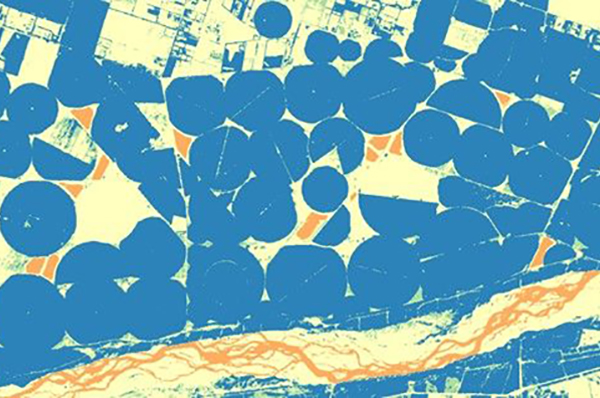
Irrigated areas detected by the normalised difference vegetation index (NDVI) calculated from Sentinel-2 satellite images. Image: Aqualinc.
Understanding where and how land is irrigated is a key input to analysing or modelling the water quality impacts of land-use and the water quantity impacts of abstraction.
After beginning with a project for Environment Canterbury to map irrigated land in Canterbury, Aqualinc mapped the whole of New Zealand in 2017 for the Ministry for the Environment.
Aqualinc Research Director Dr John Bright says this national dataset was updated in 2020, taking advantage of new satellite and aerial imagery taken during the very dry 2019 - 2020 summer. “Adding satellite imagery from 2019/2020 was very useful as it strongly highlights in a very visual manner the contrast between irrigated and non-irrigated land.”
The approach Aqualinc researchers have used to construct the dataset includes multiple lines of evidence, such as aerial photos, multi-spectral satellite imagery, resource consents, property boundaries, and expert knowledge of irrigation systems.
The 2020 dataset is now available from MfE's data service where the viewer can examine map views of irrigation in New Zealand down to street level - https://data.mfe.govt.nz/layer/105407-irrigated-land-area-raw-2020-update/
More information
Find out more about Aqualinc.
Date posted: 14 September 2021